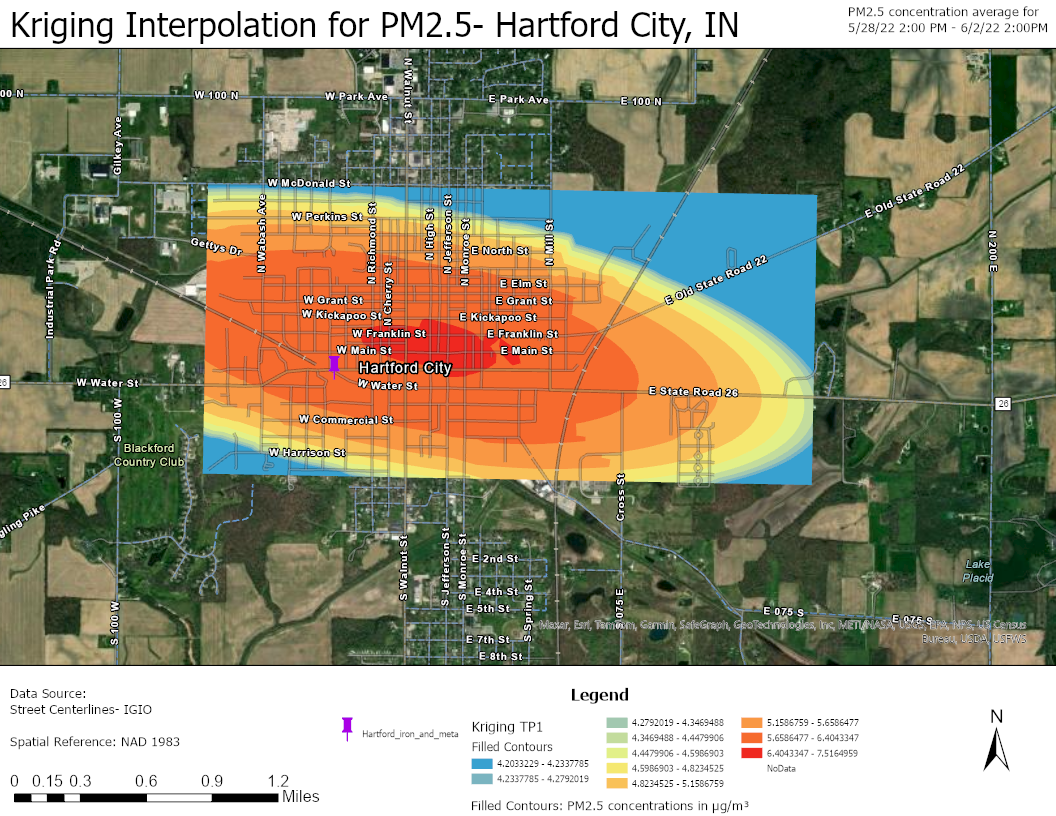
The data used in the map below are interpolated from individual monitors (N=11) which “shape” what the interpolations look like. We have approximately 8 weeks with full data from all monitors. Additional maps are being developed that take into account weather patterns and construction on Main Street.
Metal recycling facilities may release metal aerosols as well as tiny particles such as particulate matter (PM)2.5. Residents in Hartford City, a rural IN town, are concerned about their air quality due to the presence of a metal recycling facility. The goal of this research is to address community concerns by determining whether PM2.5 concentrations are elevated, particularly with respect to the facility. Eleven continuous PM2.5 monitors were placed with community volunteers to obtain PM2.5 concentrations. These monitors record PM concentrations, temperature, and humidity every 2 minutes; 4-5 months of data were collected. Wind direction was obtained from local weather stations; proximity to major highways as well as the proximity of each air monitor to the metal recycling facility was obtained using mapping programs. For analysis, GIS mapping was used to map each monitor and the metal recycling facility.
Ordinary kriging was done to view the average distribution of PM2.5 concentrations across the region. The distribution of PM2.5 concentrations were analyzed and observed using statistical software. PM2.5 concentrations varied greatly throughout time: 24-hour averages ranged from <1 to just under 26 µg/m3. This variation is much greater when observing hourly PM2.5 concentrations. The EPA has a PM2.5 24-hour standard of 35 µg/m3 and it was observed that none of the daily averages surpass this standard. Next steps include incorporation of multiple confounders, including temperature, distance, and time research. Further analysis is ongoing.